
Chatbot analytics: subscribers, messages, campaigns and automations
Learn how to track your messenger bots in KWIGA: subscriber growth, blocks, staff response time, subscriber sources and the results of campaigns and automations.
The Analytics tab in the Chatbots and messengers section shows how your bots perform: how many people subscribe and leave, how many messages come in, how fast your team replies and which campaigns and automations bring results.
It helps you see where subscribers come from, whether requests get lost and which messages your audience really cares about.
Period and bot
Open Marketing → Chatbots and messengers and go to the Analytics tab.
At the top, choose:
- Period — Last 7 days, Last 30 days, Last 90 days, Last year or Custom period with a date range.
- Bot — All bots or one specific bot.
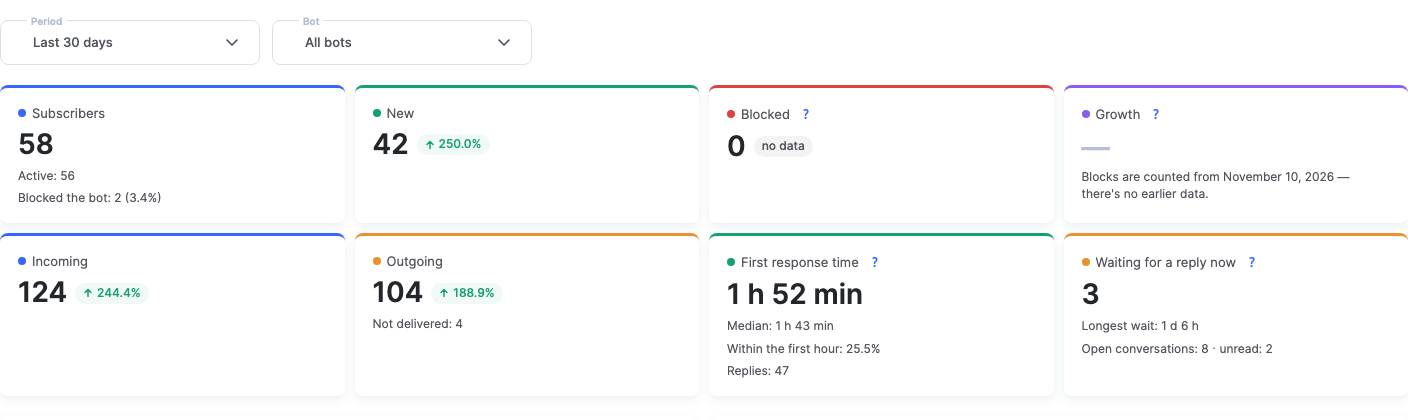
Next to most numbers you see the change compared to the previous period of the same length. For example, "↑ 250%" for new subscribers over 30 days means there were 3.5 times fewer in the previous 30 days.
Key metrics
- Subscribers — the total number of subscribers of the selected bots. Below: Active — those who have not blocked the bot, and Blocked the bot — how many and what share.
- New — how many people subscribed during the period.
- Blocked — how many subscribers blocked the bot during the period.
- Growth — new subscribers minus those who blocked the bot plus those who unblocked it again.
- Incoming — how many messages subscribers wrote.
- Outgoing — how many messages the bots sent, and below — how many of them were Not delivered.
- First response time — the average time from a subscriber's first unanswered message to an employee's reply. Below — the Median, the share of replies Within the first hour and the number of replies. Time is counted around the clock; replies from the bot, campaigns and automations are not counted.
- Waiting for a reply now — subscribers who wrote and have not yet received a reply from an employee. This is a "right now" number, not for the period. Below — how long the longest-waiting person has been waiting, and how many open and unread conversations there are.
Please note: a messenger reports a block only when the bot tries to message the subscriber. So a block may be recorded later than it actually happened. Blocks are counted from the date shown under the metric — there is no data before it.
Please note: "Active" on this tab means subscribers who have not blocked the bot. It is not the same as the "Active subscriber" line in Subscription → Resources: that one counts subscribers you exchanged messages with during the month.
Charts
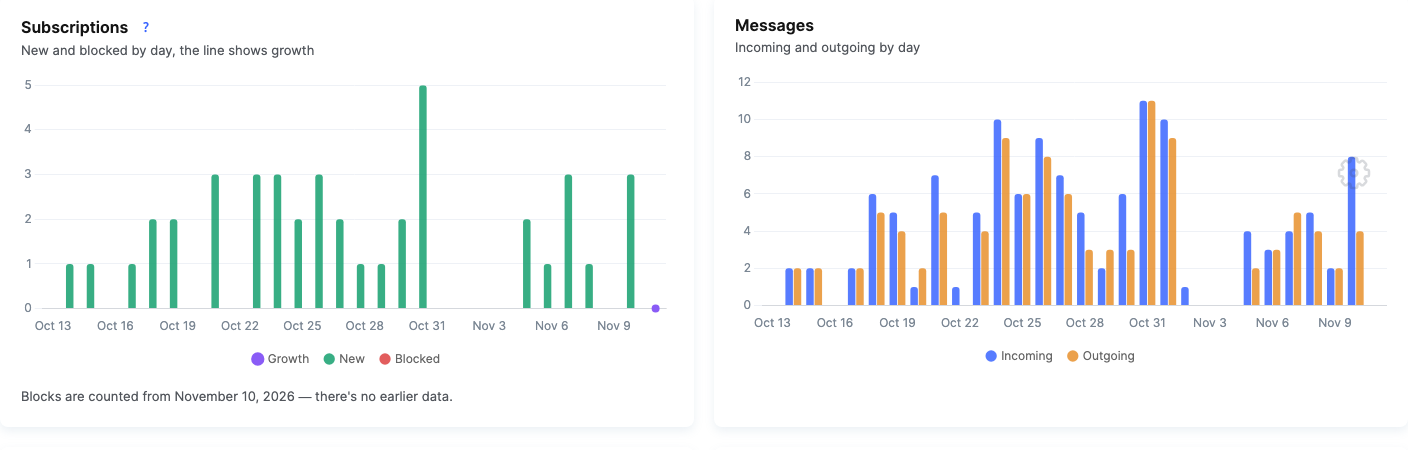
- Subscriptions — new and blocked by day, the line is growth.
- Messages — incoming and outgoing by day.
Who messages subscribers
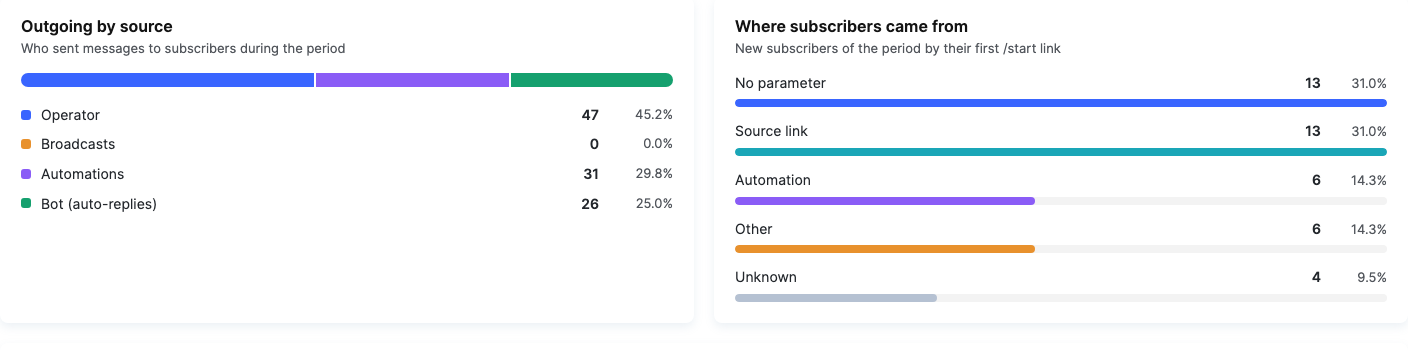
The Outgoing by source block shows who sent messages during the period: Operator (employees in conversations), Broadcasts, Automations or Bot (auto-replies).
For example, if almost all outgoing messages are bot auto-replies while the first response time grows, the team should check Conversations more often.
Where subscribers came from
The Where subscribers came from block splits the period's new subscribers by the link they first opened the bot with:
- Source link — a tagged link created in the bot settings (for example, "Instagram" or "Website"). To learn how to create one, see How to connect a bot to KWIGA, the "Links" section.
- Account linking — the person followed a link that links them to a contact in KWIGA.
- Automation — a link that starts a bot automation.
- No parameter — the person found the bot on their own or followed a plain link to the bot.
- Other and Unknown — visits whose source could not be determined.
Bots
The Bots table shows each bot's metrics for the period: subscribers, active, % of blocks, new, blocked, incoming, outgoing, first response, Sent by broadcasts, CTR, automation messages and last activity. Click a column header to sort the table.
CTR is the share of people who clicked a button in a broadcast out of those who received it. For example, 200 people received a broadcast and 30 clicked the button — CTR is 15%.
When subscribers write
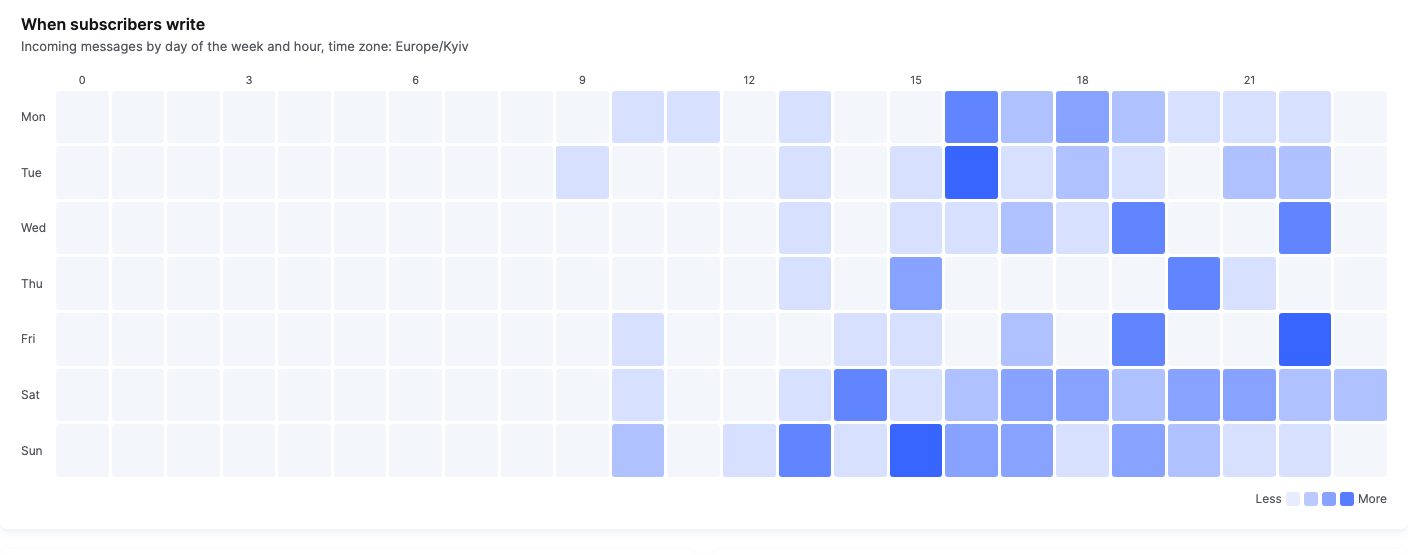
The When subscribers write heat map shows incoming messages by day of the week and hour. The darker the cell, the more messages. Hover over a cell to see the exact number.
For example, if most messages come on weekdays from 7 pm to 10 pm, it is worth having an employee available at that time — or setting up an auto-reply outside working hours.
Campaigns and automations
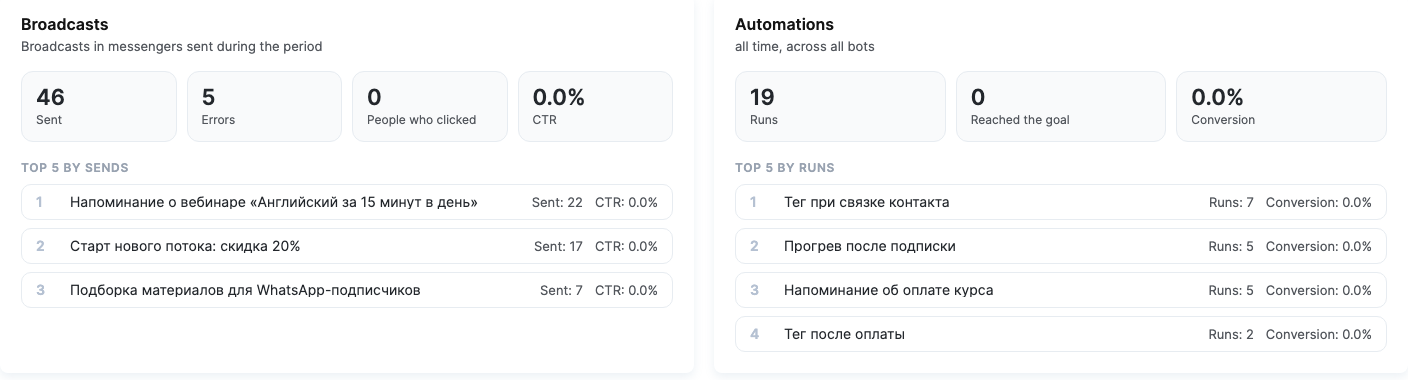
- Campaigns — messenger campaigns sent during the period: Sent, Errors, People who clicked, CTR and Top 5 by sends.
- Automations — Runs, Reached the goal, Conversion and Top 5 by runs. The subtitle shows the time span and the bots the numbers cover.
Read more about campaigns in Messenger campaigns and about automations in Automations (chatbots).
Who sees analytics
The numbers on the tab are counted for the section blocks the employee has permission to view. For example, if a role has no access to broadcasts, it will not see broadcast numbers in analytics. Permissions are set up in the access group: Settings → access group → "Chatbots and messengers" tab.
Example: finding out which acquisition channel works
- In the bot settings, create three source links: "Instagram", "Website", "Ads".
- Place each one in its own channel.
- A week later, open Analytics, choose Last 7 days and the bot.
- In the Where subscribers came from block, compare how many new subscribers each link brought.
- In the Subscriptions block, check that new subscribers don't leave right away: a high block rate after ads is a reason to rethink the bot's first message.
Frequently asked questions
What does the arrow with a percentage next to the numbers on the "Analytics" tab mean?
This is the change compared to the previous period of the same length (it's shown next to most numbers). For example, "↑ 250%" for new subscribers over 30 days means there were 3.5 times fewer of them in the previous 30 days.
Why is the bot block recorded later than when the subscriber actually blocked it?
The messenger reports a block only when the bot tries to message a subscriber, so a block may be recorded later than it actually happened. Blocks are counted from the date shown under the metric – there is no earlier data.
How do "Active" subscribers in analytics differ from the "Active subscriber" row in "Subscription → Resources"?
On the "Analytics" tab, "Active" means subscribers who haven't blocked the bot. "Subscription → Resources" counts subscribers you've exchanged messages with during the month – that's a different number.
How is first response time calculated, and are bot replies counted?
This is the average time from a subscriber's first unanswered message to a staff member's reply. Time is counted around the clock; replies from the bot, campaigns, and automations are not included.
Is "Awaiting reply now" a count for the selected period?
No, this is the current number, not for a period: subscribers who have written and haven't received a reply from a team member yet.
How is the campaign CTR calculated?
CTR is the share of recipients who clicked a button in the campaign. For example, if 200 people received the campaign and 30 clicked the button, the CTR is 15%.
Why can't the employee see campaign figures on the "Analytics" tab?
Numbers are calculated only for the section blocks the employee has permission to view: if a role has no access to campaigns, it won't see campaign numbers. You can configure permissions in the access group: "Settings" → access group → "Chatbots and messengers" tab.
Thanks for your feedback!
Thanks! We'll update the article. Need an answer now? Contact support