Articles:
- Contact capture form
- How to add a widget code to your website
- Tracking visits from the landing page through the widget
- Mini landing pages
- Adding a request form (widget) to a Weblium page
- Adding a request form (widget) to the Sendpulse page
- Adding a request form (widget) to a Wix page
- Displaying the Course Program on Your Website
- Adding an Online Chat for Students to the Kwiga Platform
- How to Create a Contact Collection Widget
- Widget Statistics: How to Track Effectiveness
A detailed overview of reports on widgets and mini-landings: how to analyze user interaction data and track conversions from your contact collection forms.
In this article:
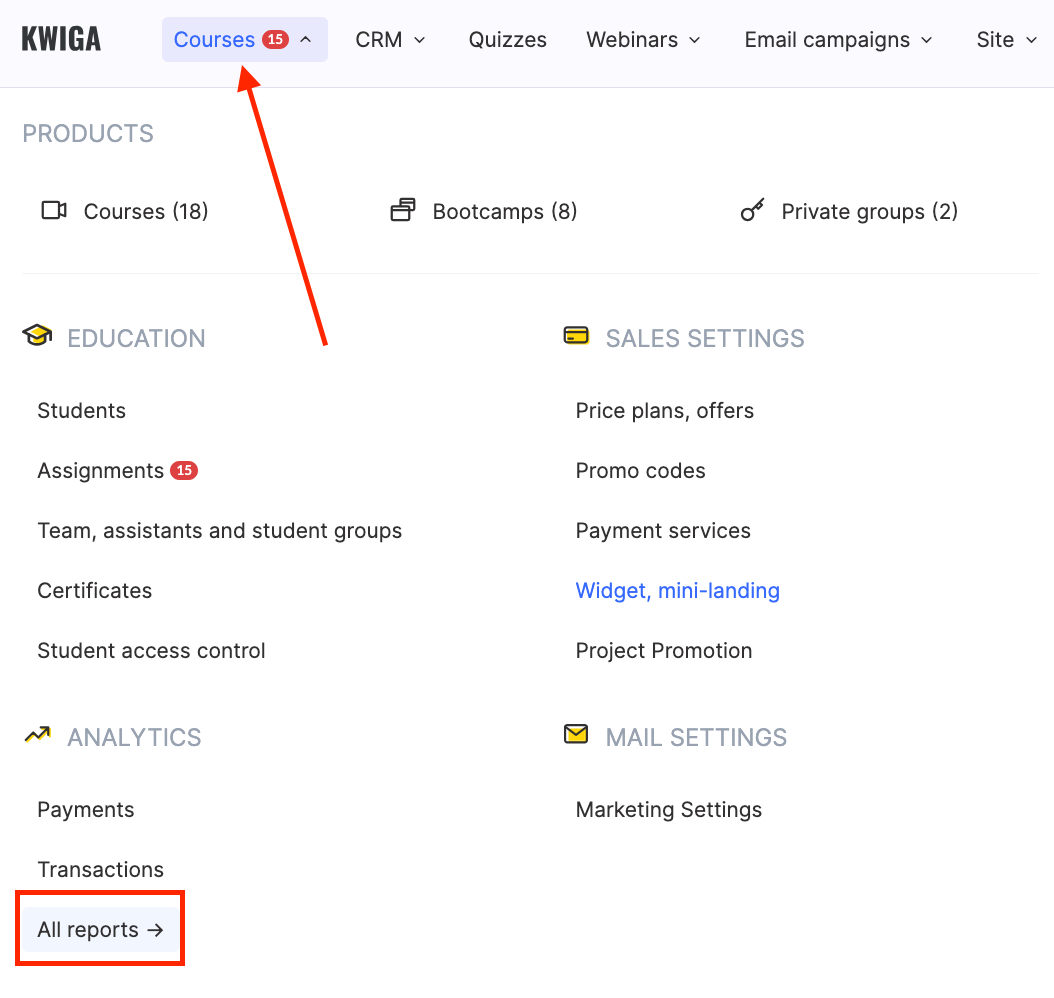
You can access widget statistics from the Courses → All Reports menu
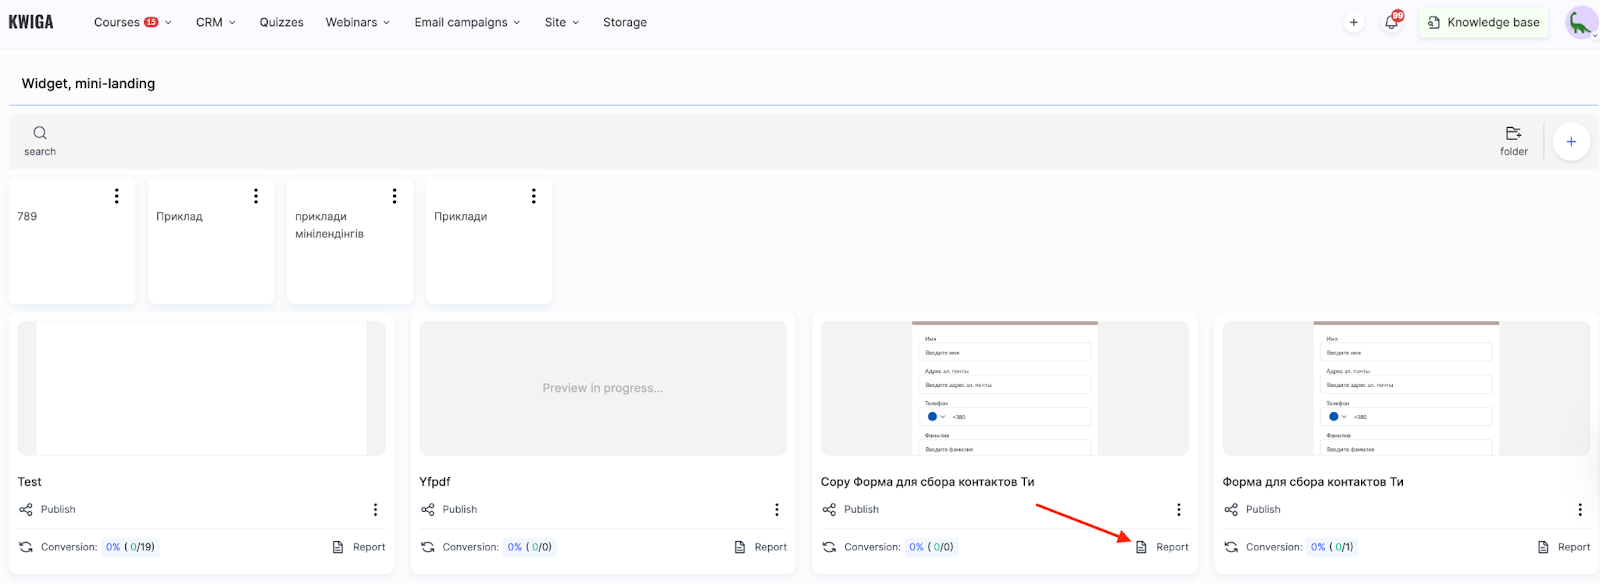
or from Site → Widget, Mini-landing.
The report provides a complete picture of your widgets' performance: the number of views and unique loads, clicks and form submissions, conversion rate for each widget, and detailed data on each contact.
For example, you may see that a widget on your blog has a high display rate (1000 views) but a low conversion (2%), while a widget on a landing page was shown only 200 times but has a 15% conversion rate. This information helps you understand where to focus your efforts to improve results.
All data updates automatically, so you always see the most current information on how users interact with your widgets.
The report has two main sections (tabs): Interaction Data and Conversion.
Interaction Data in the Widget Report
This section contains detailed information about each user's interaction with your widgets. Here, you can view a complete picture of how the interaction takes place and what data is being collected.
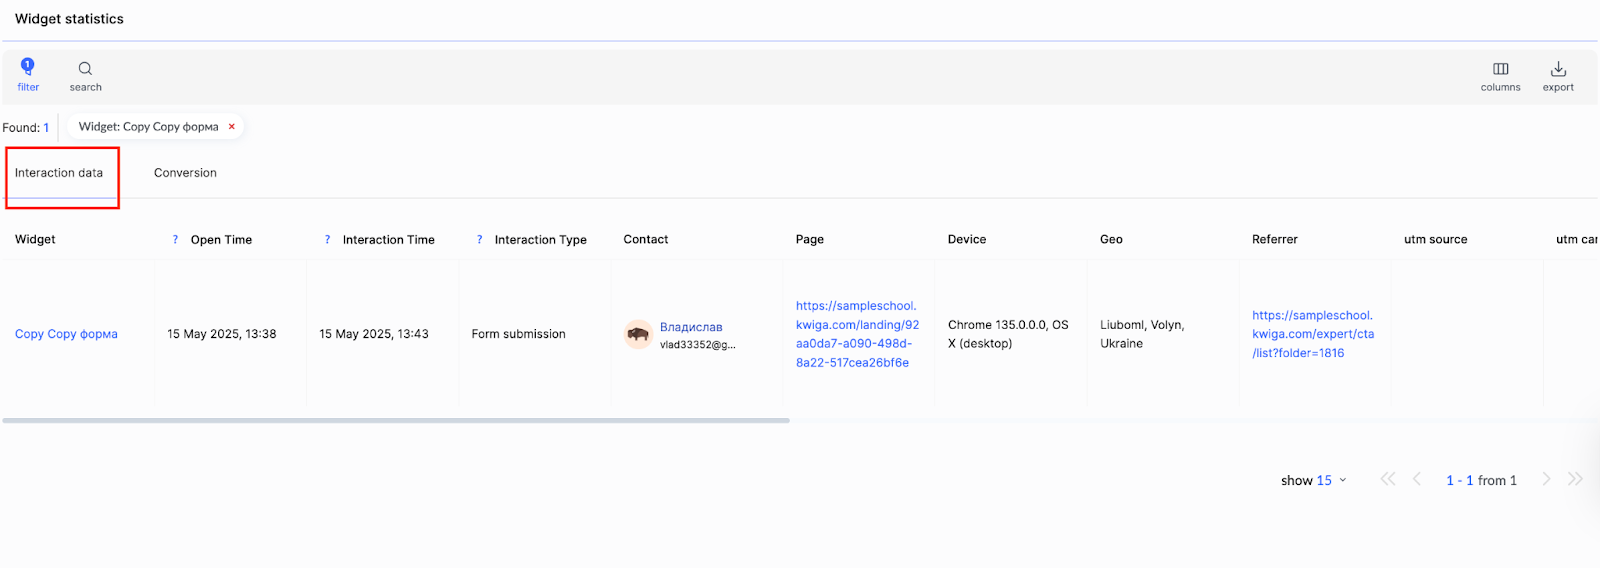
Here’s what data you can review:
-
Widget – the name of the widget with a direct link to the editor for quick access to settings
-
Open Time – the time when the user opened the page containing the widget
-
Interaction Time – the moment an active action occurred: form submission or button click
-
Types of Interaction – the platform distinguishes two main types of interactions:
-
Click is recorded for widgets that have a button without a form, e.g., buttons leading to other pages or triggering actions
-
Form Submission is recorded when a user fills in fields and submits their contact information
-
Contact – contact data with a link to the full contact card in the CRM for further follow-up
-
Page – link to the page where the widget is placed
-
Device – type of device used, if identifiable (e.g., desktop)
-
Geo – user’s geolocation
-
Referrer – the source from which the user navigated to the page
-
UTM Tags – parameters for tracking traffic sources:
-
utm_source – traffic source
-
utm_campaign – campaign name
-
utm_medium – traffic channel
-
utm_term – keyword
-
utm_content – content
-
Form Data – information the user entered into the widget form
-
Redirect – the page the user is taken to after submitting the form
-
Linked Offer – name and link to the offer the widget directs to (e.g., for payment or access)
-
Linked Product – name of the product, such as a course
This section is handy for analyzing traffic sources and lead quality. UTM tags can help identify the most effective ad campaigns, while geolocation and device data allow you to tailor widgets to a specific audience. For example, if most conversions come from mobile devices, you can optimize your widget design specifically for smartphones.
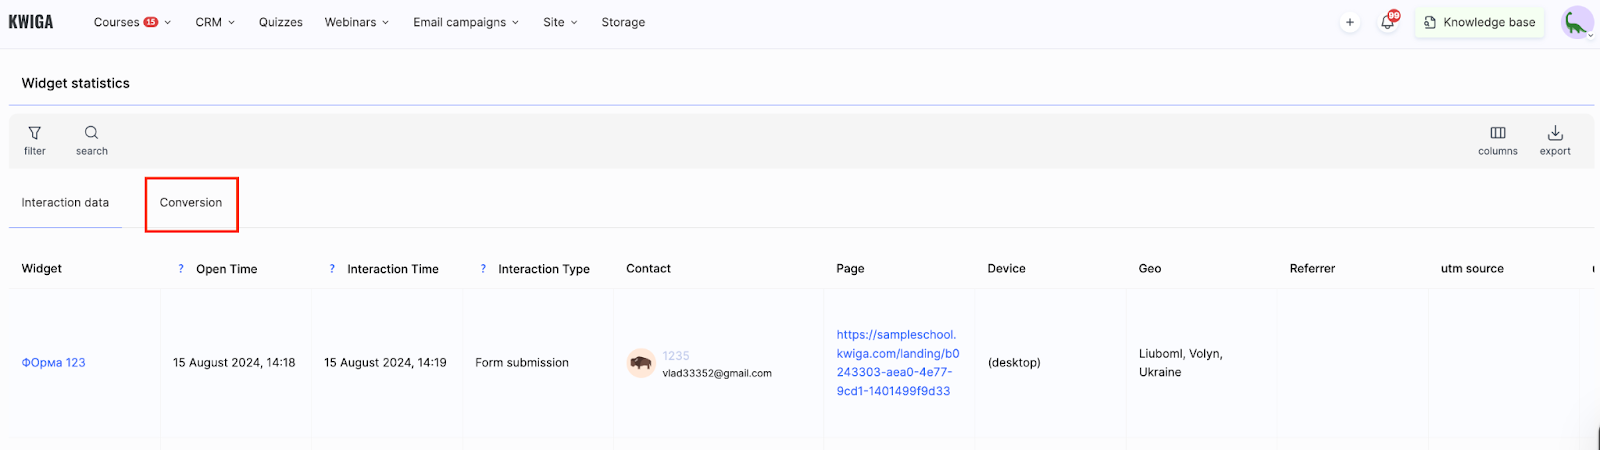
Conversion in the Widget Report
This section shows the effectiveness of your widgets through key conversion metrics:
-
Widget – the name of the widget and a link to its editor.
-
Conversion (Views) – reflects the ratio of active actions to views in the format:
Clicks, Form Submissions / Views -
Conversion (Loads) – the percentage ratio of successful actions to widget loads in the format:
Clicks, Form Submissions / Loads -
Clicks – the number of times users clicked on links, banners, or buttons (outside the form block)
-
Form Submissions – the number of times users submitted form data
-
Views – the number of times users saw the widget on the page
-
Loads – unique widget loads on the page. A widget successfully loading does not necessarily mean the user saw it — it may be placed outside the user's initial screen view.
Note: If the number of loads is significantly higher than the number of views, this may indicate that the widget is placed too low on the page and users are not noticing it.
Analyzing these metrics together provides a complete understanding of your widgets' effectiveness. For example:
-
If loads are high but views are low, the issue might be visibility.
-
If views are sufficient but conversions are low, you may need to improve the widget’s content and design.
All information is structured and easy to read, allowing quick decision-making to enhance widget performance. Use this data to test widget variations and find the best-performing solutions for your audience.
Didn't find the answer? Contact the support service via online chat or Telegram