
Quiz analytics: how students take a quiz and what they answer
Learn how to view quiz analytics in KWIGA: how many students opened and completed the quiz, statuses, retention and time per question, scores, answer distribution, answers by lesson, and export.
Quiz Analytics shows how students take a quiz and how they answer its questions. You can see how many people opened and started the quiz, which questions they most often stop at, how long it takes them, and how the answers are distributed.
This helps you spot where a quiz is too hard or too long, collect students' opinions in a survey, and compare how the same quiz is taken in different lessons.
Where to find analytics
Open the quiz and click Analytics in the quiz's top bar — next to Task and Preview.
It has two tabs:
- Learning — how students take the quiz: how many started and finished it, what statuses their attempts got, how long it takes, and which questions students stop at.
- Assessment — what exactly students answer: scores, answer distribution by question, individual members' answers, and results by lesson.
The Sales tab isn't available yet.

Filter, search and attempt selection
Above the tabs there's a toolbar for narrowing down the data:
- filter — narrow down students by the Product and location group (Product, Select an offer, Lessons) and the Attempt group (Attempt status). For example, keep just one lesson if the quiz is placed in several.
- search — find a student by name or email. Search narrows only the student tables; the cards and charts are calculated for everyone.
- attempt — which attempt of each student to show: Last, First (1), or an attempt with a specific number. If you choose a number, only students who had that attempt are included.
- export — download the table of the open tab to a file.
Please note: there's no date range here — analytics covers all time.
The “Learning” tab
Visitors, members and time
- Visitors — how many students opened the quiz.
- Members — how many students started the quiz, that is, began an attempt.
- Average completion time — how long one finished attempt takes on average.
Below are the members' statuses: In progress, Completed, Passed, Failed, Needs revision, Under review. Each status shows the number of students and their share of all members. “Completed” includes students with the statuses “Passed”, “Failed”, “Needs revision” and “Under review”.
Click a status to filter the members table below by it. Click again to clear the filter.

Charts
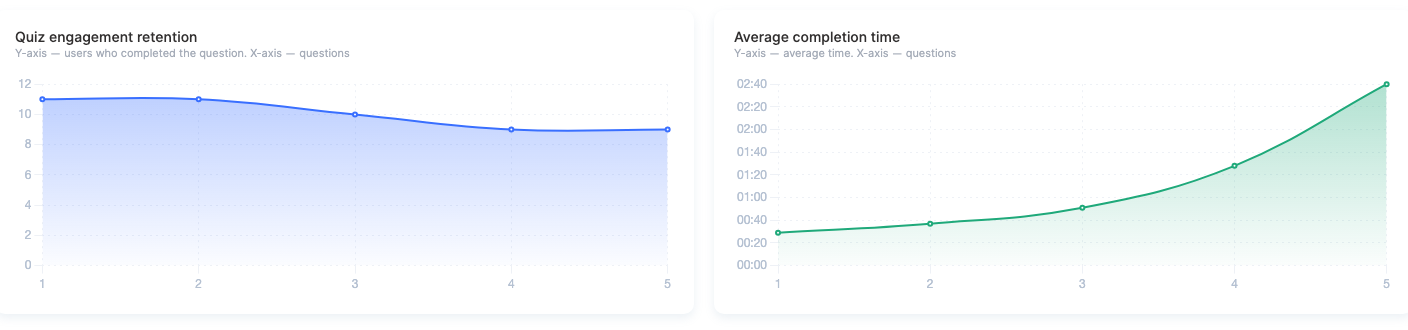
- Quiz engagement retention — how many students answered each question in order. If the curve drops sharply after a question, that's where students most often abandon the quiz.
- Average completion time — how much time students spend on each question. A high point is a question students think over longer than the others: it may be worth simplifying or splitting it.
Members table
Each row is one student and the selected attempt: Member, Location (the lesson and course where they took the quiz), Status, Attempt, Started, Finished and Time.
In the Report column, a finished attempt has the links View (the student's answers) and Download result (a file with the result of that attempt).
A student who opened the quiz but didn't start it is shown with the Not started status — if the Last attempt is selected and there's no status filter.
You can sort the table by the Started, Finished and Time columns.
The “Assessment” tab
Only finished attempts count here: with Last selected, it's each student's last finished attempt.
Scores
Average score, Highest score and Lowest score are calculated from Rating and NPS questions, converted to a 0–10 scale: for example, 4 stars out of 5 is 8. Under the average score, you'll see how many students answered such questions.
If the quiz has no scored questions, the cards show No data.

Questions, members, lessons
Below are three sections. To open a section, click its heading. Each section has its own export button.
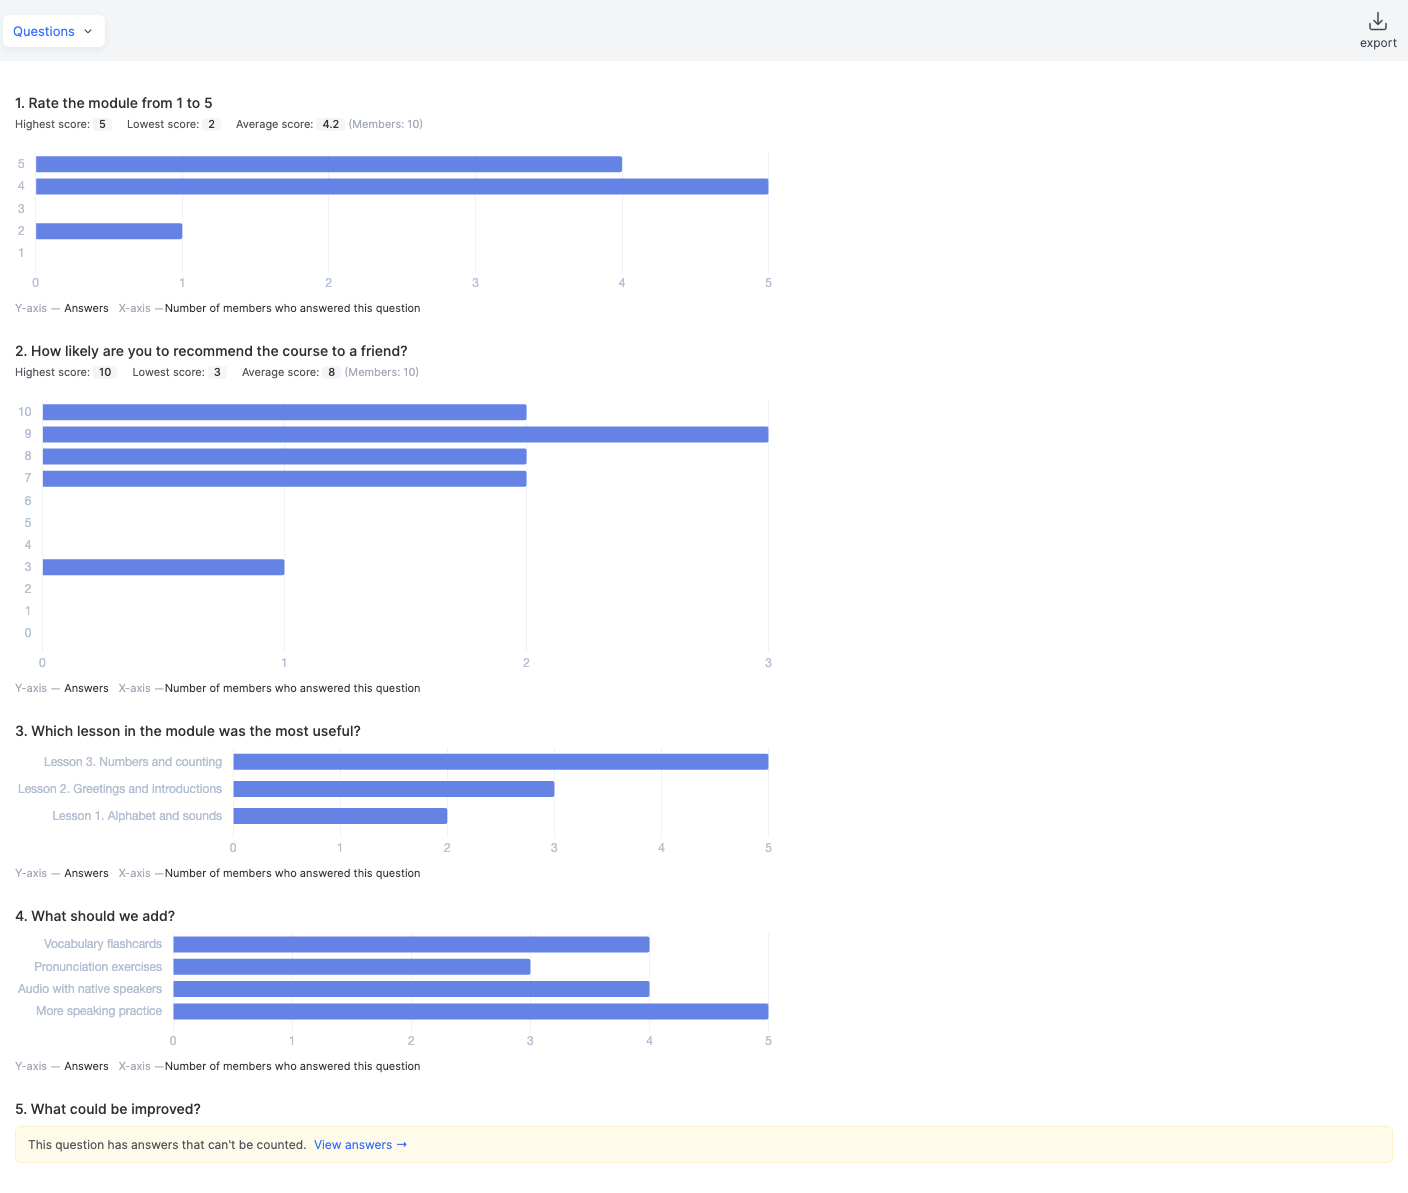
- Questions — for each question: for scored questions, the highest, lowest and average score; for multiple-choice questions, a chart of how many members chose each option. Questions answered in the student's own words show This question has answers that can't be counted. and a View answers link.
- Members — a table: the student, Status, Attempt, Completion date and a column with the answer to each question. Skipped means the question was shown to the student but there's no answer; a dash means the student didn't get that question. You can sort the table by scored questions.
- Lessons — the same answers grouped by the course, module and lesson where the quiz is placed. This is handy if one quiz is placed in several lessons or courses: you can see where the answers differ. The Skipped row shows the share of students who skipped the question in that lesson.
Answers to the question
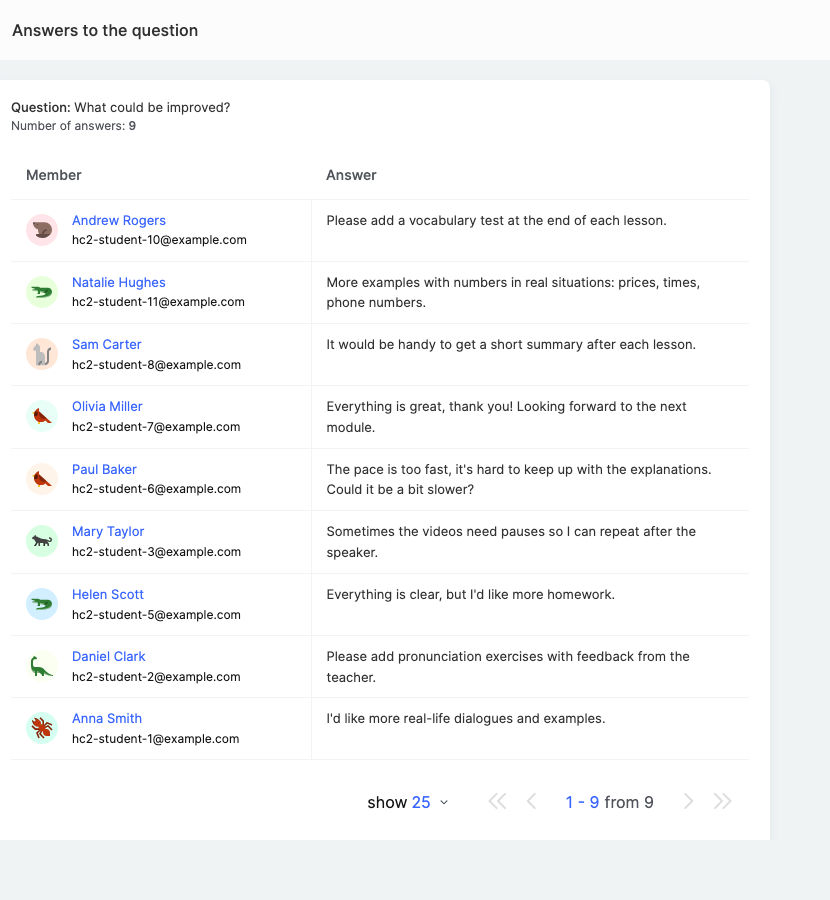
Click View answers next to a question, or the percentage next to an option — the Answers to the question panel opens on the right, showing which student answered what. Opened from an option's percentage, the panel shows only the students who chose that option.
Export
The export button downloads the table to a file: on the Learning tab — members and their attempts; on the Assessment tab — members with their answers to each question; the Questions, Members and Lessons sections each have their own export. The beginning of the file records the selected filter, search and attempt.
Learn more about exporting answers in How to Export Quiz Responses to a Separate File.
Who can see analytics
Analytics is available to team members with permission to view the Assignment answers report and to assistants. An assistant sees only their own students and the products where they are an assistant. Exporting to a file requires the Export permission.
Please note:
- Analytics includes students who got paid access to the product where the quiz is placed — including those whose access period has already ended or whose subscription wasn't renewed. Students on the waiting list, with revoked access, and deleted students aren't counted.
- On the Learning tab, the last attempt is the most recent one, even if unfinished; on the Assessment tab, it's the last finished one. That's why one student's status and attempt number may differ between the tabs.
- The numbers update with a short delay — up to a few minutes.
- This screen doesn't show test points or pass percentages — see them in the Assignment answers report.
Example: a survey after a module
- Add a survey quiz to the last lesson of the module with the questions “Rate the module from 1 to 5”, “How likely are you to recommend the course to a friend?” and “What should we improve?”.
- A week later, open the quiz → Analytics → Assessment: the Average score shows the overall impression of the module.
- Open the Questions section: the charts show which options are chosen most often.
- Next to “What should we improve?”, click View answers and read the students' suggestions.
- On the Learning tab, look at Quiz engagement retention: if many students drop out halfway through the survey, shorten it.
Frequently asked questions
Can I view quiz analytics for a specific period?
No, you can't select a date range – analytics cover all time. You can narrow the data using filters for product, offer, lessons, or completion status.
Why didn't the numbers in the cards and charts change after I searched for a student?
Searching by name or email only filters the student tables. Cards and charts still include all students.
Why does the same student have a different status and attempt number on the "Learning" and "Grading" tabs?
On the "Learning" tab, the latest attempt is the most recent one, even if it is incomplete. On the "Assessment" tab, it is the most recent completed attempt. As a result, a student's attempt status and number may differ between the tabs.
Which students are included in the quiz analytics?
Those who received paid access to the product containing the quiz, including students whose access has expired or whose subscription has not been renewed. Students on the waitlist, those whose access has been revoked, and deleted students are not included.
Why do the scorecards say "No data"?
The average, highest, and lowest scores are calculated from "Rating" and "NPS" questions, normalized to a scale of 0 to 10. If the quiz has no such questions, the cards will show "No data".
Where can I see my score and test completion percentage?
They aren't shown on the quiz analytics screen – scores and completion percentages are available in the "Assignment answers" report.
Can an assistant view quiz analytics?
Yes. Assistants and staff with permission to view the "Assignment Answers" report can see the analytics. Assistants can only see their own students and the products they assist with. To export to a file, you need the "Export" permission.
Thanks for your feedback!
Thanks! We'll update the article. Need an answer now? Contact support