Articles:
- How to give access to the course
- How to access a student's account
- How to see the progress of participants
- How to Create a Certificate and Add It to a Course
- Automation: Awarding points upon completing lessons
- Conducting surveys (reactions, ratings, NPS)
- How to view all test attempts
- How to set up a test retake
- How to update a student's rate and keep their progress
- How to change access settings for a single student
- How to change the expiration date of the course
- The student entered wrong email
- How to extend access to the course
- Automation: Setting up reminders if a student does not log into the platform
- How to unblock a user
- How to "freeze" access to a course
- How to find an email with a code needed to access Kwiga account
- Viewing the course as a student
- Pre-registration or waiting list.
- Importing and transferring the student database
- Comments: a convenient tool for user interaction
- Certificate Issuance After Passing a Test
- How an Expert Can Access Their Student Profile
- Student Registration and Authorization
- Certificates Report
- Manual issuance and reissuance of a certificate
Learn more about how to view information about participants, including their progress on the course, the number of lessons completed, and the number of practical assignments completed.
In this article:
- Available Participant Progress Data in a Course
- How Progress is Calculated
- How to View a Brief Progress Report
- General Detailed Report in the Analytics Menu
- Advanced Report on Practical Assignments
- Lesson View Statistics
- How to View Detailed Statistics of an Individual Participant
- How a Participant Sees Their Course Progress
To effectively track your participants' success, the Kwiga platform provides a convenient tool for progress analysis. You can see how many lessons have been viewed, which practical assignments have been completed, and assess participants' overall activity.
Available Participant Progress Data in a Course
A brief summary of progress is displayed in the Participants tab, where you can quickly see how many lessons have been watched, which practical assignments have been completed, and whether a certificate has been issued.
A detailed report with in-depth progress analysis is available in the Progress, Analytics tab. Here, you can evaluate the success of all participants using filters and advanced export options. If you need to assess quickly what a specific participant has completed, you can go directly to their personal statistics from this section.
A separate report on practical assignments allows you to analyze the completion of course practices—this tool is handy for methodologists who develop training programs.
How Progress is Calculated
Participant progress is measured using four key indicators:
-
Viewed Lessons – The ratio of completed lessons to the total number of available lessons. A lesson is viewed if 85% of its content is watched (or if the user spends at least 5 seconds on a page for lessons without video/audio).
-
Practice Progress – The percentage of completed practical assignments.
-
Practice Points – The earned points relative to the maximum possible.
-
Overall Progress – A combined metric that considers both lessons and practical assignments.
Important: Progress is calculated only for lessons and assignments available to the student. For example:
-
If a course has 20 lessons, but the participant's plan grants access to only 15, completing all 15 lessons will show 75% progress.
-
If the "Hide unavailable lessons" feature is enabled (found in Course Settings > Public Pages), progress is calculated only based on visible lessons. In this case, the student will see 100% progress.
-
Specific practical assignments can be excluded from progress calculations (configured in the Lesson Builder settings).
How to View a Brief Progress Report
After launching the course and adding participants, all key data is displayed in the course details. To view it, go to the Courses menu, select the desired course, and open the Members tab.
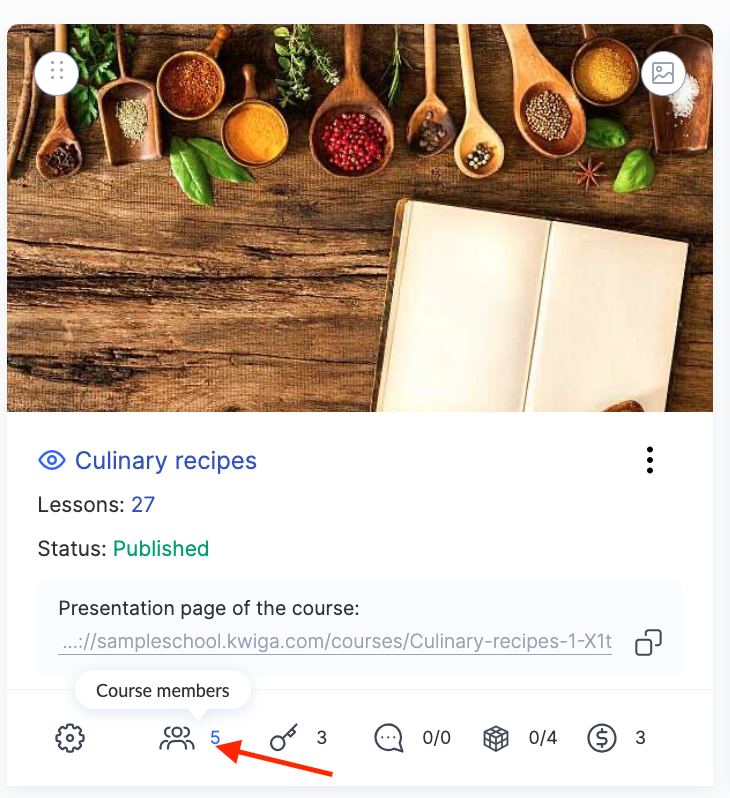
Here you will see a complete list of everyone enrolled in your course, with key indicators of their progress.
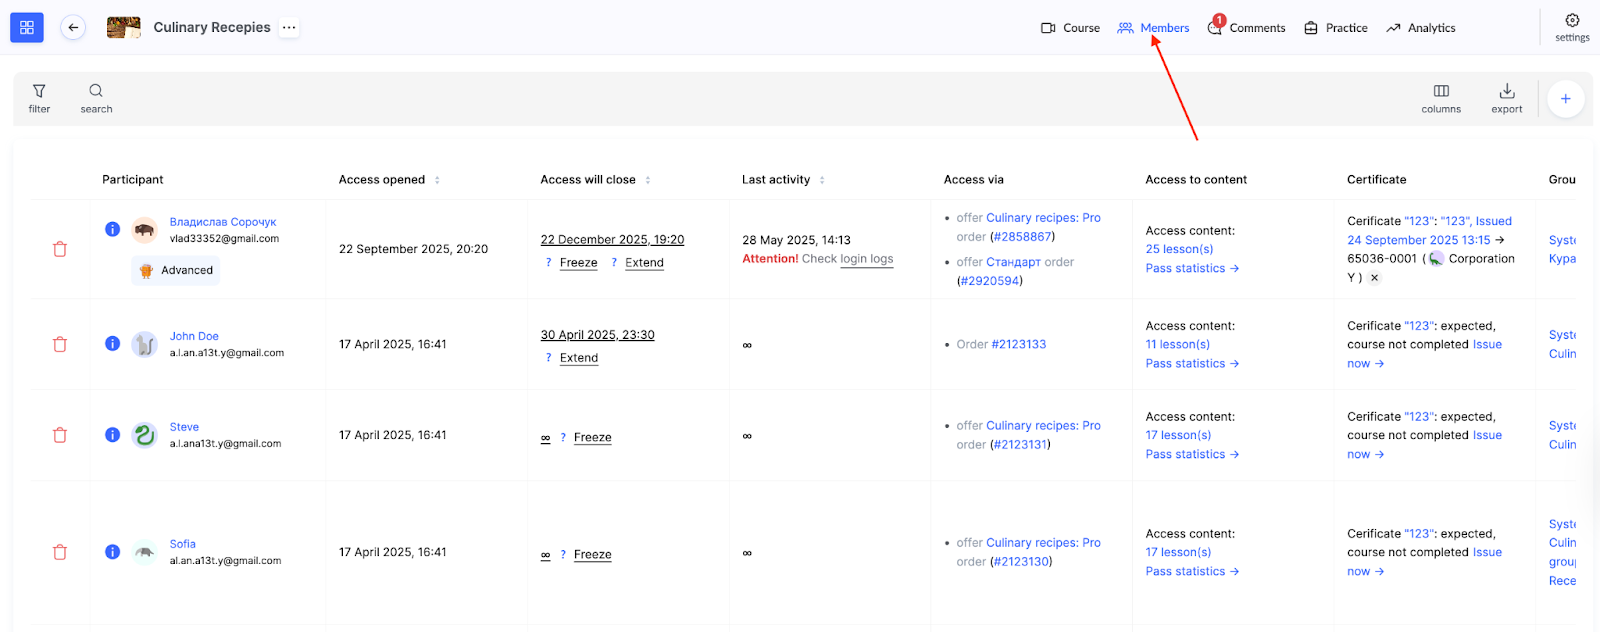
The page displays the participant’s name and email address, the dates when access was opened and closed, and the title of the offer through which access was granted. You can also check whether a certificate was issued after course completion and view the participant’s most recent activity within the course. This helps quickly identify those who have stopped studying or who may need additional support.
In addition to basic information, data on learning progress is available, including the percentage of lessons viewed and practical assignments completed. These indicators allow you to instantly assess how actively a participant is progressing through the course and whether they are completing the practical tasks.
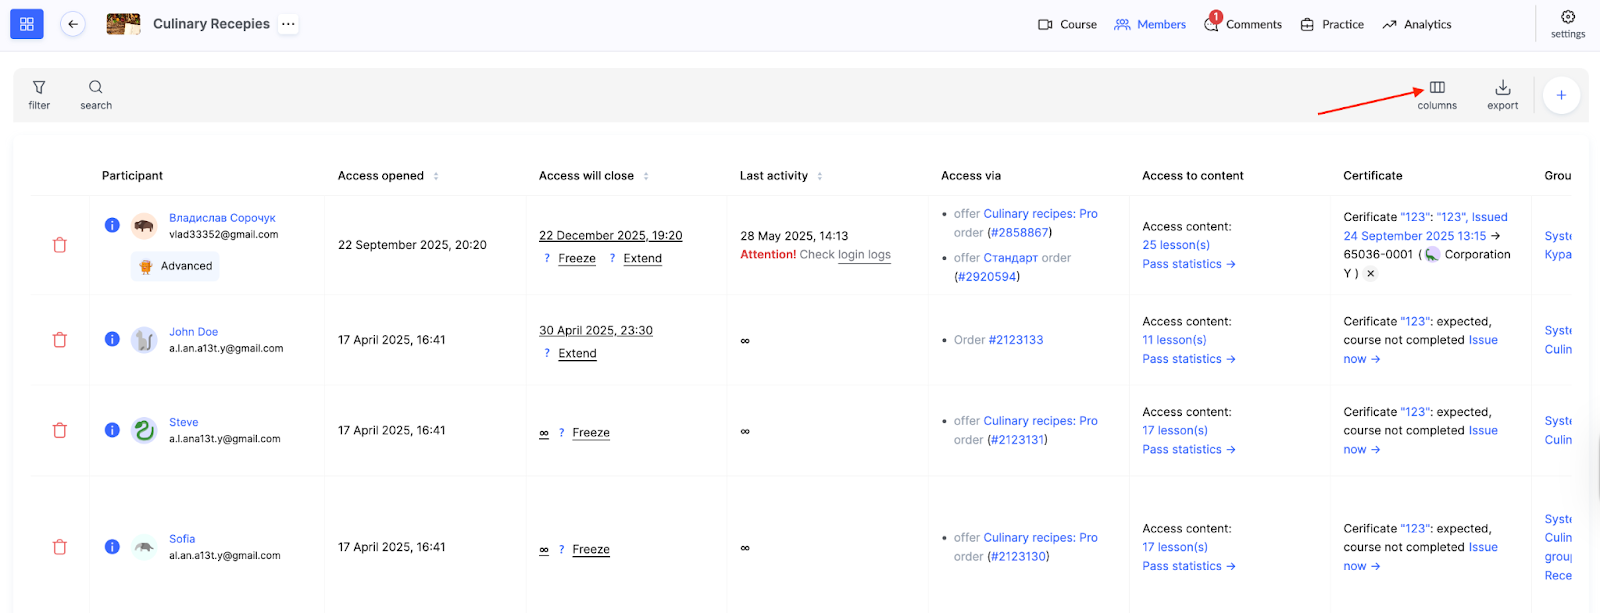
You can customize which columns are displayed on this page by using the Columns button in the upper-right corner. This is especially convenient when you need to focus on specific metrics or work with many participants.
On this same tab, you can also manage course access: extend or temporarily freeze it, manually issue a certificate, or completely remove a participant from the course. All the key tools for managing participants are gathered in one place.
General Detailed Report in the Analytics Menu
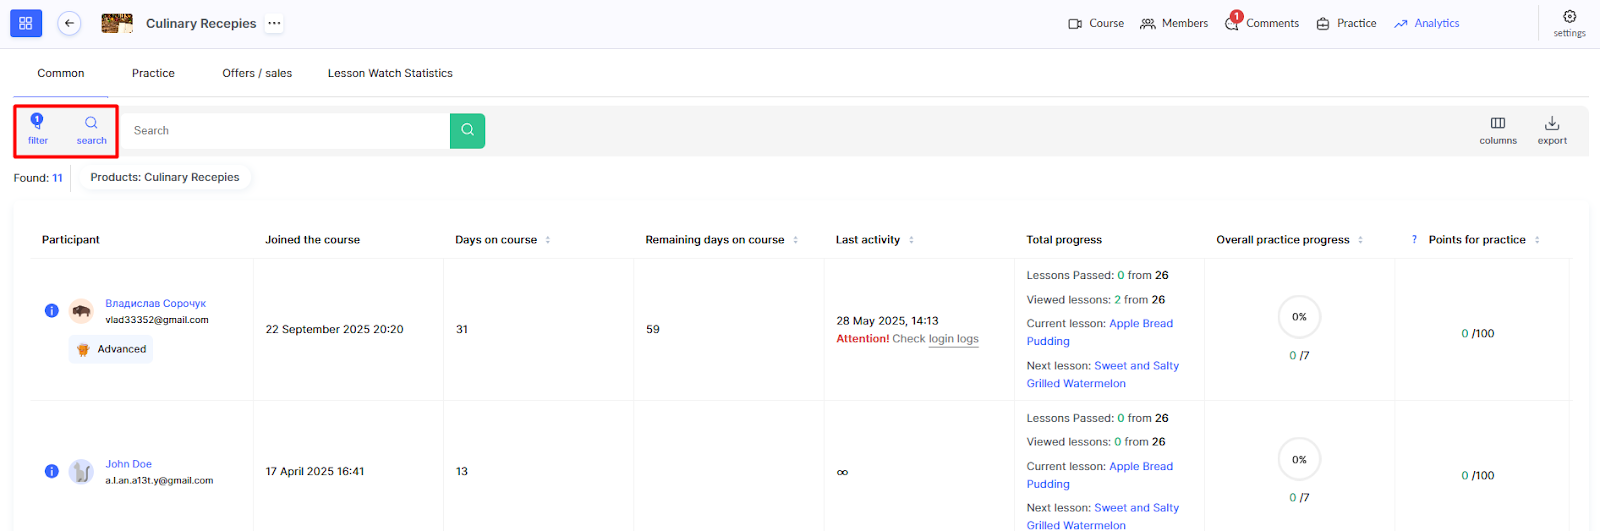
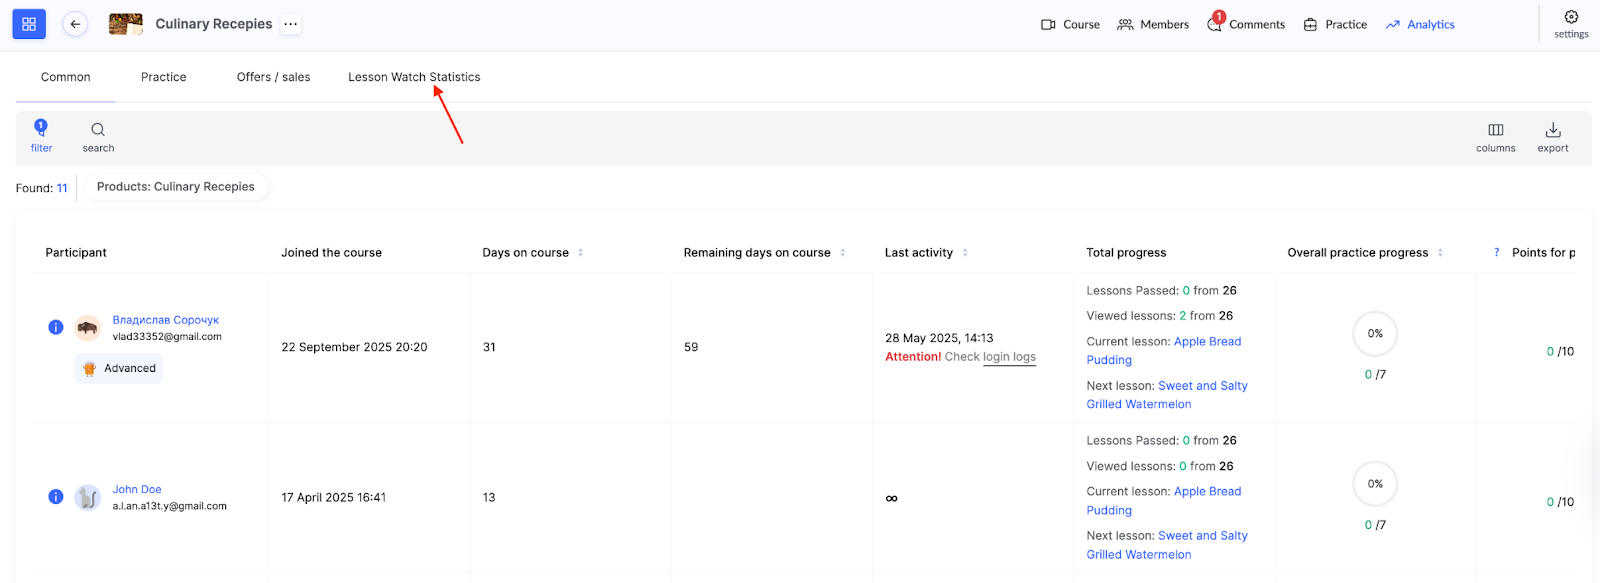
For deeper analysis of participants’ progress, go to the course menu Analytics → Common tab.
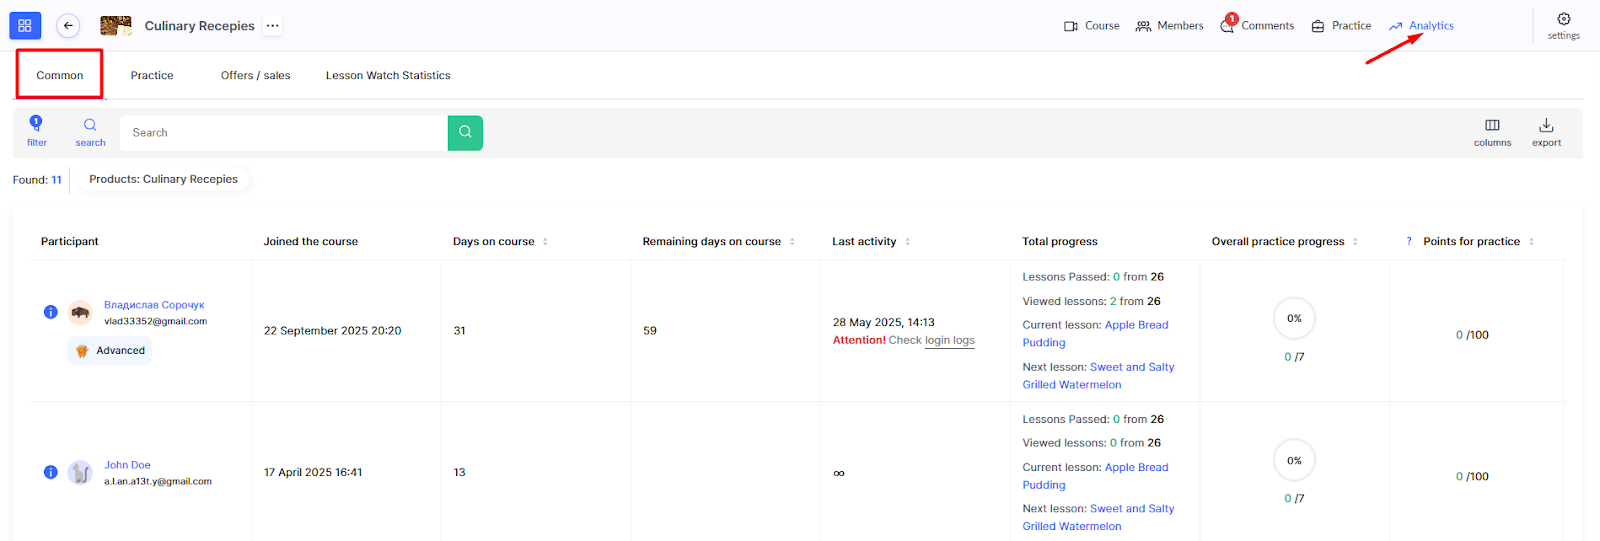
Here, you can see the participant’s enrollment date, how many access days have been used and how many remain, the total progress percentage, and the percentage of completed practices. You’ll also find the points earned for practical assignments and the date of last activity. I
If a participant is assigned to a curator, their name is displayed, along with the offer or order through which access was granted.
The report includes a filter that allows you to analyze progress by specific participant groups. You can view progress for a particular pricing plan (offer), filter participants by tags, compare progress between curators or groups, and more. This is especially useful for large courses with multiple participation formats.
For even more detailed analysis, click the Export button to download an extended report. In the export settings, you can select which fields to include in the report and choose the file format for export (CSV or XLSX).
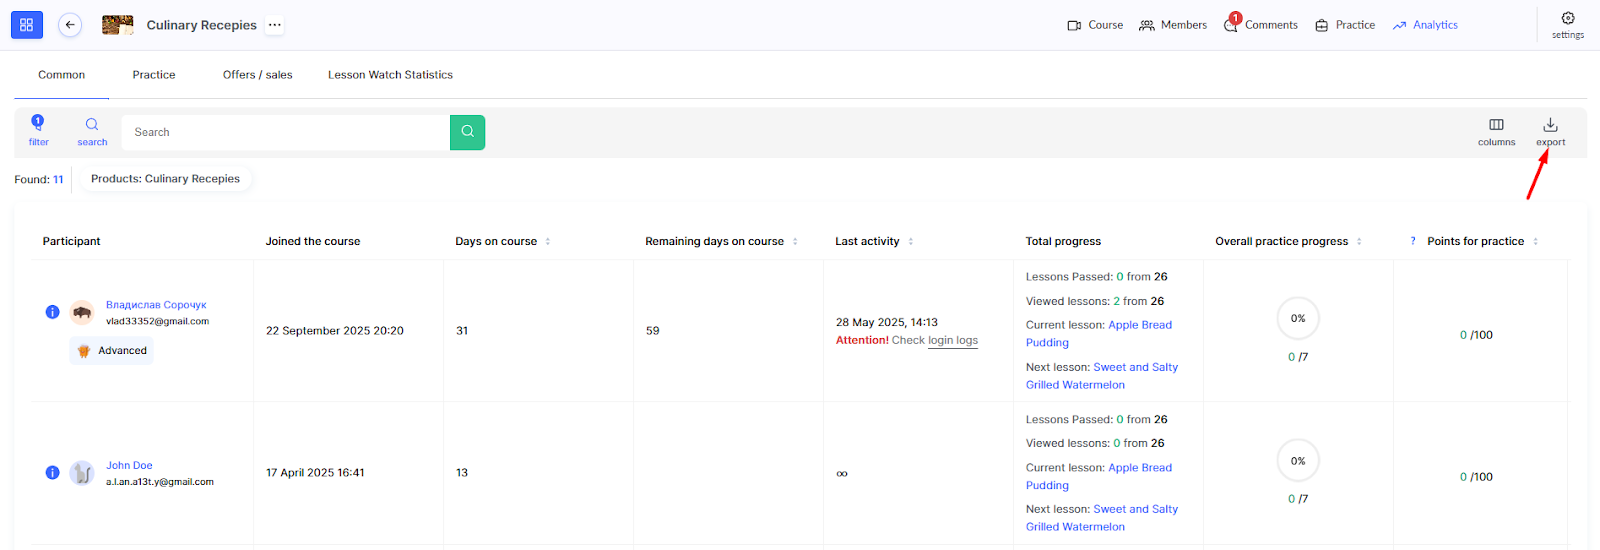
In addition to students’ personal information, you can obtain data on each lesson or practice individually. Click Export, and you’ll receive a file listing all viewed lessons, the completion status of each task, and the points earned for every practice.
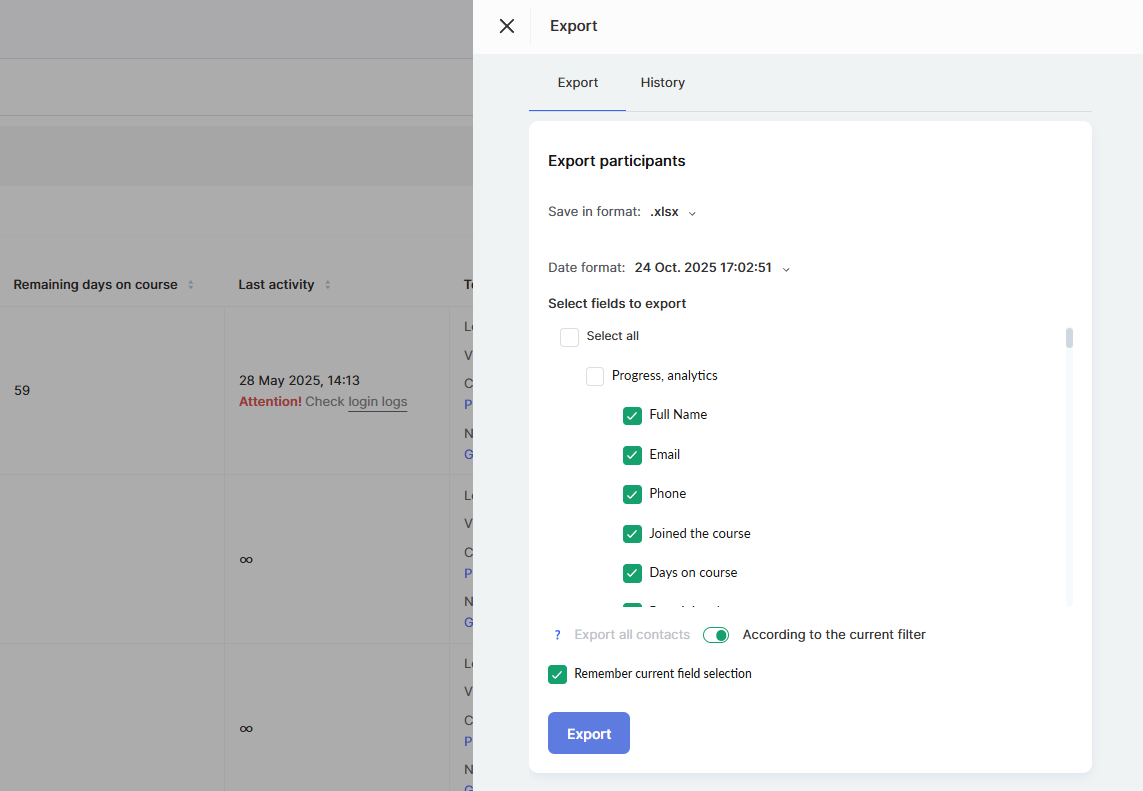
All exported progress reports are stored under the History tab. To download the desired report file, click the download button next to it.
Important: Report files count toward your account’s storage resources. Therefore, we recommend deleting unnecessary files after downloading them to avoid exceeding storage limits.
Advanced Report on Practical Assignments
The Practice tab within the course analytics section allows you to track participants' completion of practical assignments. This report helps evaluate their progress, analyze results, and identify areas that need improvement.
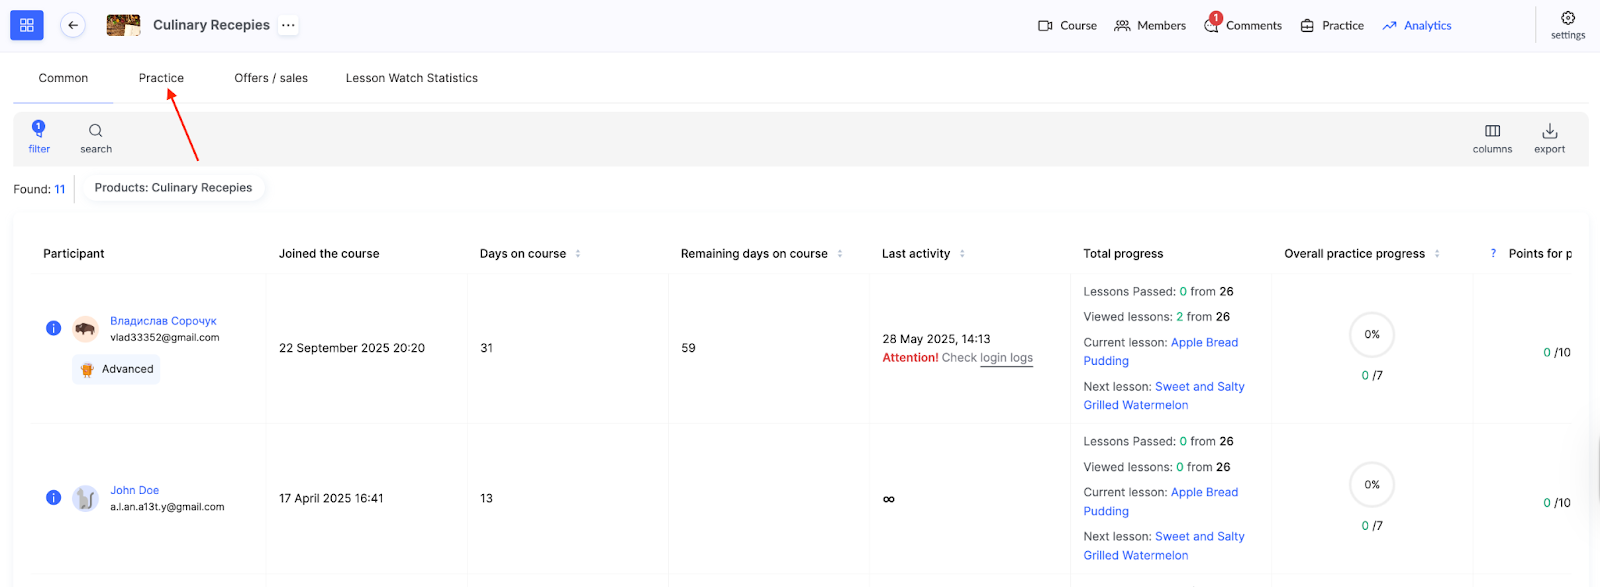
For example, if a particular assignment has a low average score or a large number of attempts, this may indicate that it is too difficult or not clearly formulated and therefore needs adjustment.
If you need to conduct a more in-depth analysis or share data with your team, the report can be exported in CSV or XLSX format. This is convenient for creating your own analytical tables, charts, or presentations.
Detailed information about all metrics and their meanings can be found in the article “Report on Course Practice Completion.”
Lesson View Statistics
The report contains basic information about the participant, the lesson title, the module it belongs to, and the viewing status. You can see exactly when the participant first opened the lesson and when they finished viewing it. The report also shows the lesson completion date and time.
If the lesson includes a practical assignment, the report will display the assignment’s status, the start and completion dates, as well as the total duration of work on the task. This allows you to see a complete picture of the participant’s interaction with each element of the course.
How to View Detailed Statistics of an Individual Participant
If you need to analyze the progress of a specific participant, the platform offers several ways to access personalized statistics.
You can navigate to it in a few different ways.
Method 1: Through CRM
-
In the CRM → Contacts menu, find the desired person.
-
Click their name to open the contact card.
-
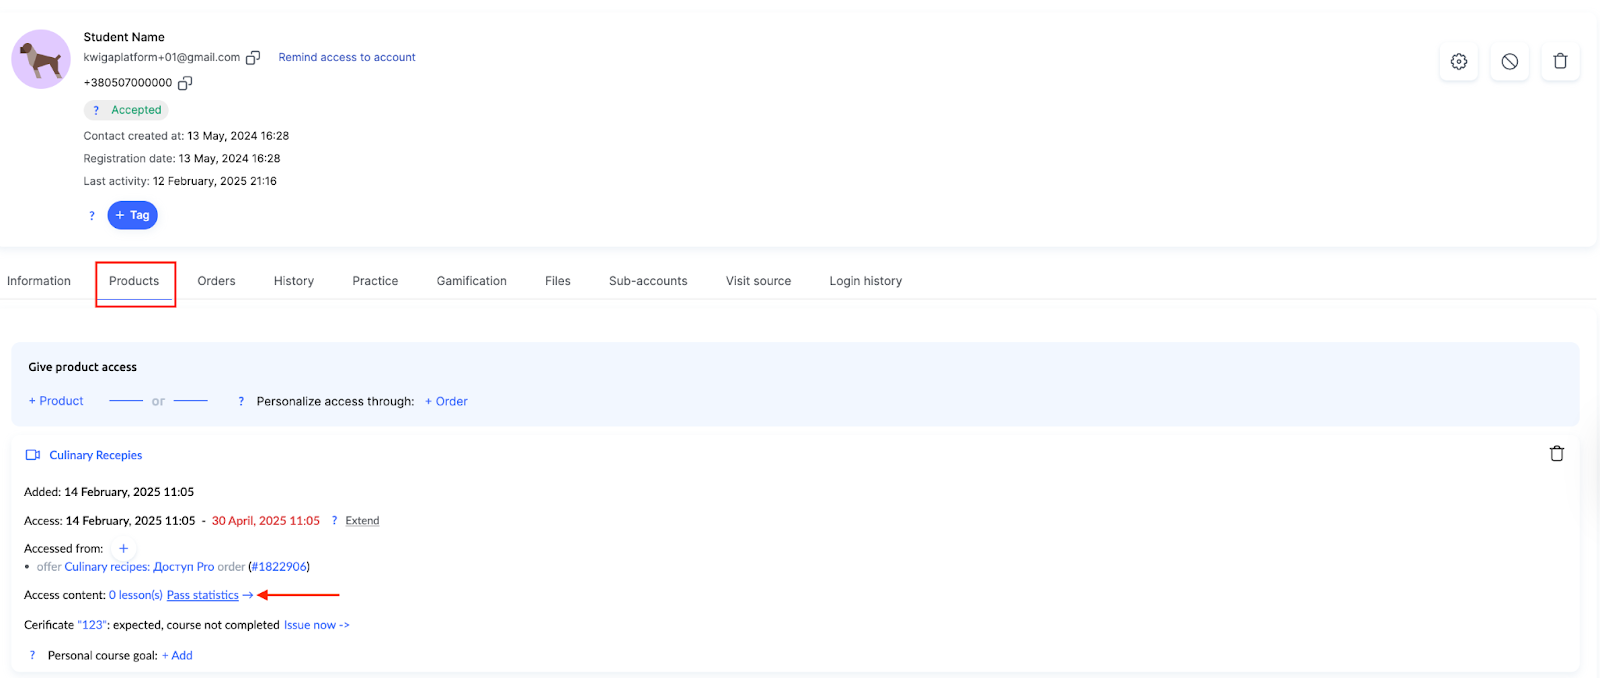
Go to the Products tab within the contact card.
-
Here, you can access the full statistics of this person’s lesson progress and practical assignment completion within the course.
Method 2: Through the Analytics Menu
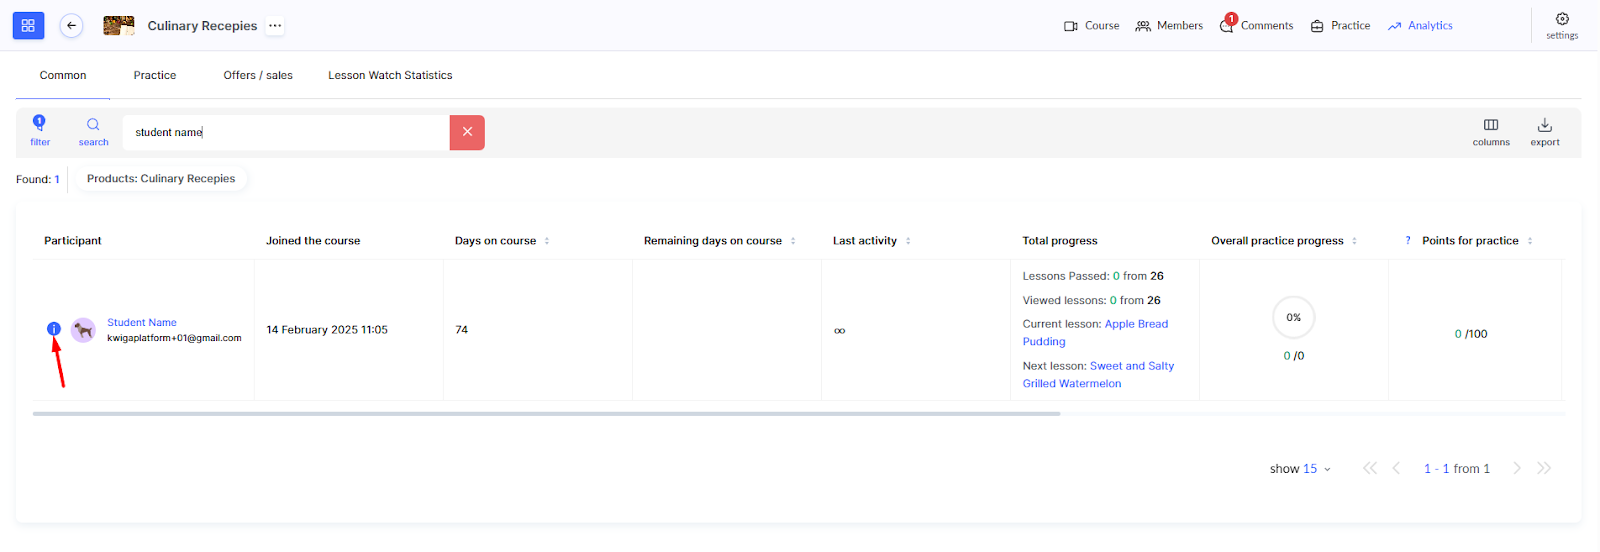
On the Progress tab in the Analytics menu, you can use the search bar to find a participant by their email address.
To view detailed progress statistics, click the information icon (i) next to the participant’s name in the list.
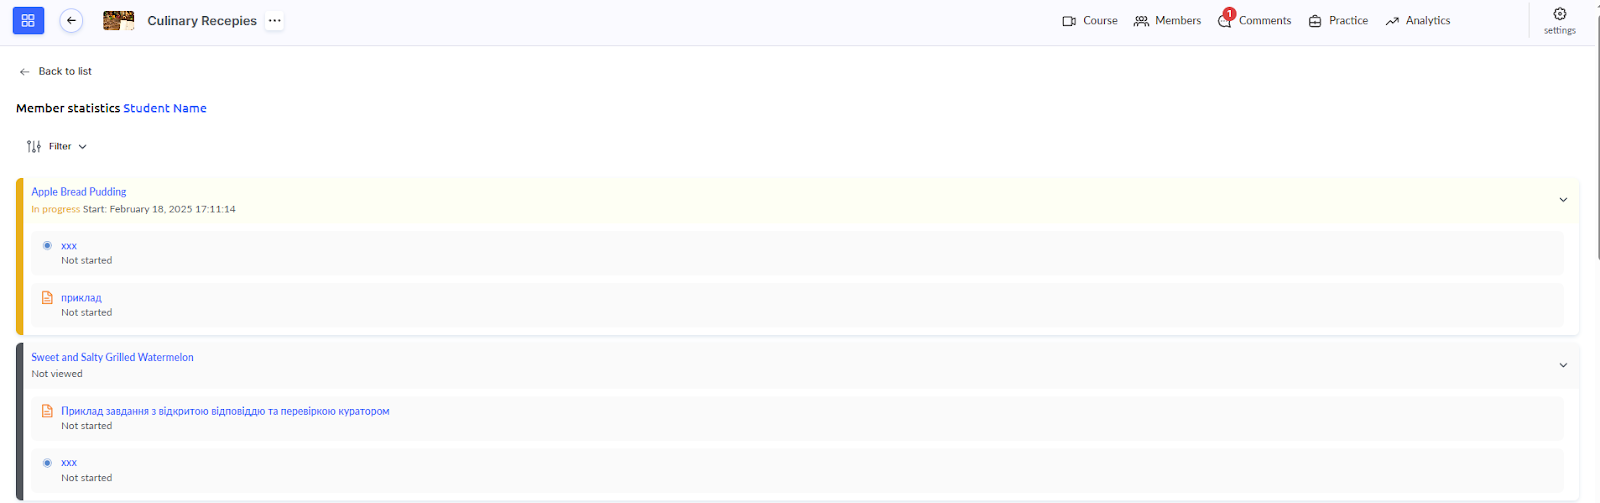
This data helps analyze an individual participant’s performance and, if necessary, adjust their learning path.
How a Participant Sees Their Course Progress
Course participants can independently track their progress directly on the learning platform. This helps them understand their achievements and see how much material remains to be completed.
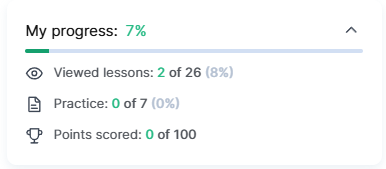
On course pages, participants see a “My Progress” block showing their overall completion percentage. It displays the number of lessons viewed out of the total, the number of completed practical assignments, and the total number of points earned.
In the course program, next to each lesson title, participants see visual status indicators.
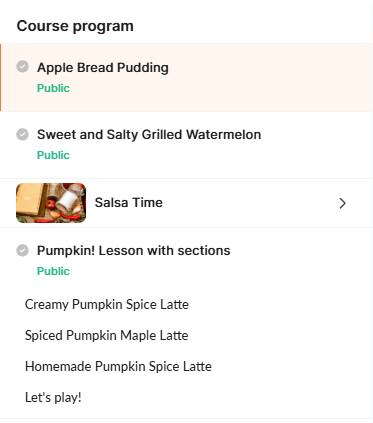
A gray checkmark means the lesson has not yet been viewed. A green eye indicates the lesson has been viewed but not fully completed. A green checkmark signals that the lesson is fully completed, including all practical assignments.
Didn't find the answer? Contact the support service via online chat or Telegram