
Video and audio stats: how students watch your lessons
Learn how to see video and audio statistics for your lessons in KWIGA: plays, completed plays, average watch time, the viewing heatmap, which parts get rewatched, and how each student watches.
Report Video and audio statistics shows how students watch videos and listen to audio in your course lessons: how many times they played them, how many watched or listened to the end, where they stopped, and which sections they replayed.
This helps you understand which videos work, where lessons lose students' attention, and which students actually watched the material.
Use the report not only to count views, but also to improve your learning materials. For example, you can identify videos that are too long, explanations students replay several times, sections they find difficult, and materials that receive little attention.
Where to find the report
Open the Reports page (under Courses → All reports) and in the Progress section, select Video and audio statistics.
You can also open the report from a student's page in a course: lessons with media have a link called Media statistics for this lesson.
The first option is useful for analyzing all media across courses. The student's page lets you quickly open media statistics for a specific lesson without leaving the context of their learning.
What the table shows
Each row represents one video or audio file in a specific lesson block.
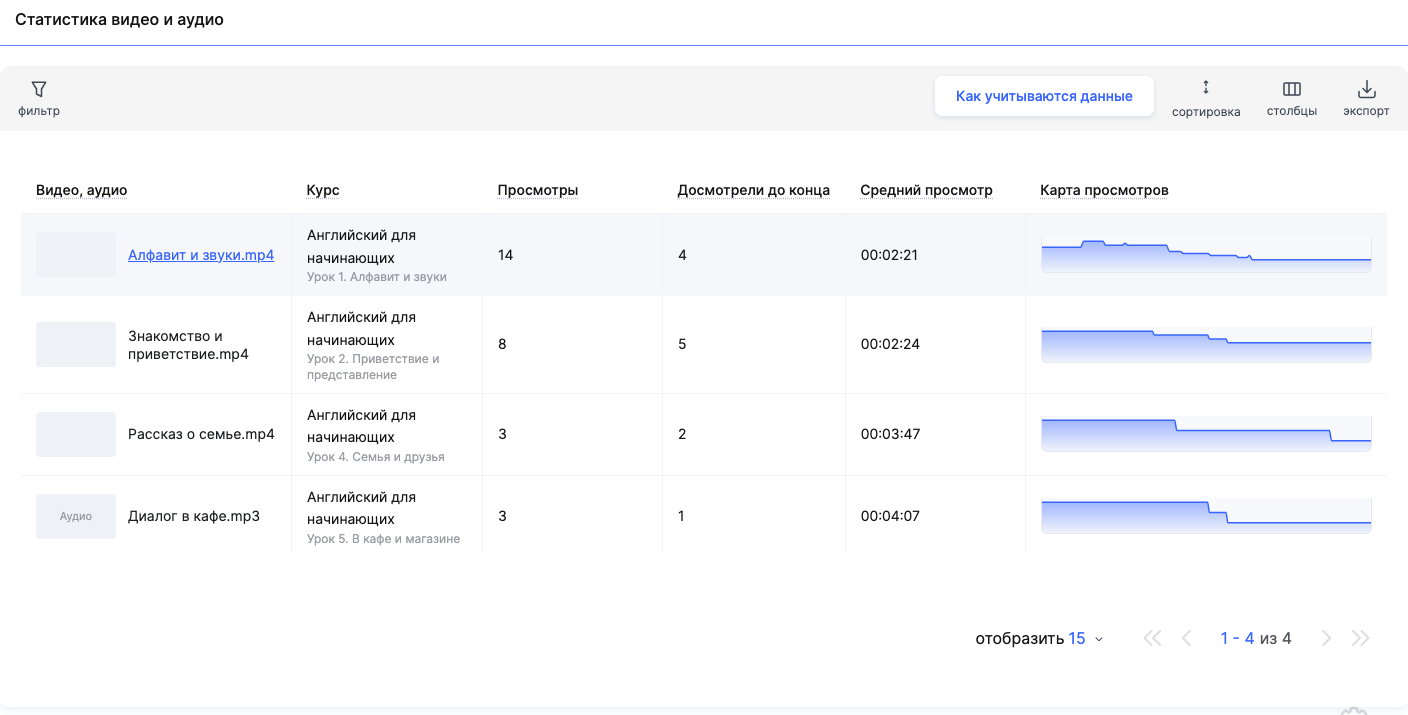
- Video, audio — the file name. For videos from an external service, this is the lesson block name. Audio files have the label Audio.
- Course — the course and lesson containing the media.
- Views — the number of times the media was played, including repeat views by the same viewer.
- Completed views — the number of views that reached the end.
- Average watch time — the average time watched per play. Time spent replaying sections is also included, so the average can be longer than the video.
- View map — which sections were watched most often. The higher the line, the more viewers watched that section; a dip indicates where viewers stopped watching.
Under Columns you can add other metrics: Unique viewers, Anonymous viewers and Anonymous views (watched without signing in to an account), Player impressions, View conversion, % and Suspicious — plays with signs of inaccurate time tracking. Each column has a question-mark tooltip.
Please note: the same video embedded in different blocks is counted separately — each block has its own row.
How to interpret the metrics:
- If there are significantly more views than unique viewers, some viewers have played the video more than once. They may be reviewing complex topics or returning to the material.
- If player impressions are high but view conversion is low, students may see the video in the lesson but not play it. Check whether the value of the material is clearly explained and whether the video is easy to find in the lesson.
- If the average watch time is close to the full video length, that's a good sign of engagement. Keep in mind, though, that replaying parts of the video also increases this metric.
- If the "Watched to the end" count is noticeably lower than the number of views, check the viewing map to find where students most often stop watching.
Filtering and sorting
In the filter select media using the fields Date (viewing period), Player, Course, bootcamp, Lesson and Video and audio, then click Apply filter. You can save the filter settings on the Saved filters.
sorting — As in the course outline, Most views first or Fewest views first. export exports the table to a file.
When to use filters:
- Course analysis. Select a specific course to compare video and audio statistics across its lessons.
- Period analysis. Select the dates to see how students watched the materials during a particular week or month.
- Finding popular materials. Sort the table by views in descending order to see which videos are played most often.
- Finding materials with low engagement. Sort by views in ascending order. This makes it easier to find videos that students rarely play and check whether they're needed in their current form. Videos that weren't opened during the selected period won't appear in the table.
If you regularly analyze the same courses or periods, save a set of filters so you don't have to set them up again.
Detailed video analysis
Click a row to open the Detailed analysis for that video or audio:
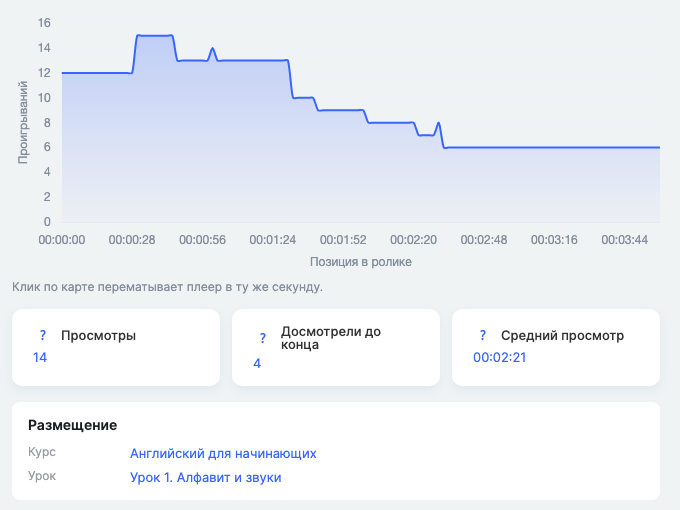
- a view curve showing views at each point in the video — click it to jump to that point in the player and see what's happening there;
- the bar below the player: blue shows sections viewed less often than usual, orange shows sections viewed more often than usual;
- Views, Watched to the end, Average watch time and Location — the course and lesson, with links.
How to analyze the view map:
- A sharp drop may indicate a point where students lose interest or encounter a difficult explanation. Review this section: you may want to shorten it or add examples.
- Frequently viewed sections may contain important information that students want to revisit, such as a complex formula, instructions, or a demonstration of a practical task.
- A steady curve without significant drops may indicate consistent viewing throughout the material.
Don't draw conclusions based on the shape of the curve alone. For example, students replaying a difficult section doesn't necessarily mean the explanation is poor: they may be returning to it to better understand the topic.
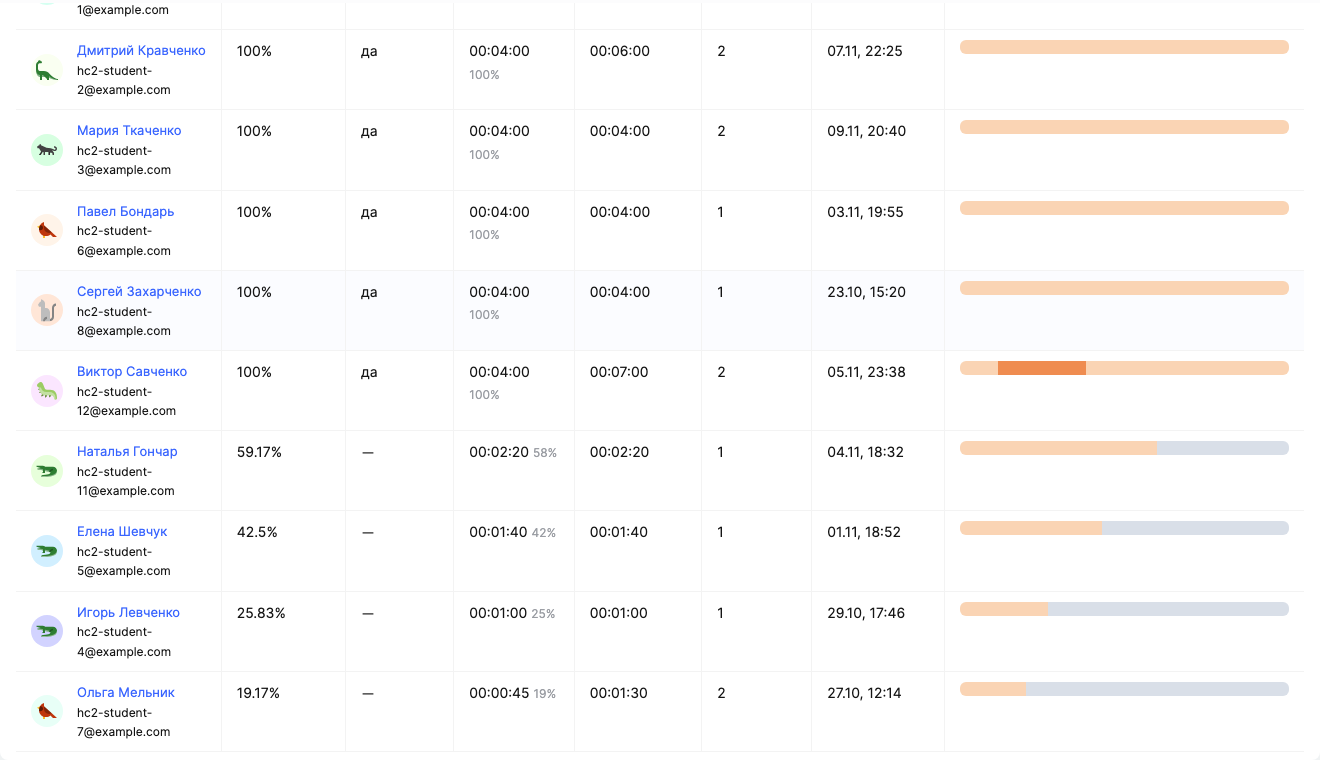
Below is the Studentstable, showing how each student watched. If a large number of students watched the video, only those with the highest coverage appear in the list and search results.
- Coverage — the portion of the video the student watched at least once.
- Watched to the end — whether the student watched to the end.
- Reached — the furthest point reached in the video.
- Time played — the total time played, including replays.
- Opens — the number of times the student opened this media.
- When viewed and Viewing map: gray — not viewed, blue — viewed once, orange — rewatched.
How to use the students table:
- Check whether a student has viewed the material. Look at coverage and the "Watched to the end" indicator to see how much of the video they watched.
- Find students who skipped part of the material. If coverage is low, the student may have watched only the beginning or selected parts of the video.
- See which topics students revisit. Orange areas on the viewing map show which parts the student rewatched. This can help an assistant identify topics worth discussing further.
- Check activity. Compare the number of sessions, viewing time, and coverage. For example, several sessions with low coverage may mean the student returned to the video but never watched it in full.
Note: student data covers all time, while the graph above covers only the selected period. The students table shows only the students you have permission to view; overall numbers include all viewers.
Media on the student's page
On a student's course page, each lesson with video or audio has a row labeled Media: N of M viewed. Click it to see the lesson's media marked Viewed / Not viewed (for audio — Listened / Not listened) and the same metrics: Coverage, Reached, Played, Sessions, Watched and Viewing map.

For more details about the student's page, see the article Student's course page.
This section is especially useful for assistants who provide individual support to students. For example, if a student struggled with an assignment, you can check whether they watched the relevant video and which parts they viewed. This can help you decide whether to ask the student to revisit the material or explain the topic in more detail.
How data is counted
The How data is counted button in the report opens a quick guide. Key points:
- Date viewed — a view is counted on the day it started. If a student starts watching at 23:50 and finishes after midnight, the entire view is counted on the start date.
- Time zone — the period is based on your profile's time zone, or UTC if none is set. The viewing map groups views by UTC day, so views from adjacent days may appear at the edges of the selected period.
- Updates — a view appears in the report when a student closes the tab or leaves the page. If the tab stays open, the data will appear later, within 13 hours. Views in progress aren't visible yet.
So don't draw final conclusions about views immediately after a lesson or webinar. Give the system time to update the data before analyzing the results for the selected period.
Example: finding where students drop off during a lesson
- Open the report and sort by As in the course curriculum.
- Find a video where Watched to the end is significantly lower than Views.
- Open its Detailed analysis and look at the curve: a sharp drop shows the point where students stop watching.
- Click the drop to jump to that point in the player. There may be a long pause or a complex topic that would be better split into two short videos.
Example: finding students who haven't watched the course materials
- Open the report and use the filter to select the course and lesson.
- Click the row for the video you want.
- In the Students table, find students who watched only a small portion. Students who never opened the video won't appear in this table — you can find them on the student's course page, marked Not viewed.
- If needed, open the student's course page and check their overall progress.
This helps an assistant identify students who haven't reviewed the materials and remind them to watch the lesson.
Example: identifying materials to improve
- Select the course and the period you want to analyze views for.
- Find videos with a low number of views or a low completion rate.
- Open Detailed analysis and review the viewing map.
- Check the sections students skip or rewatch most often.
Use this data to decide which videos to shorten, where to add explanations, examples or supplementary materials, and which sections to leave unchanged.
Frequently asked questions
Why is the average watch time longer than the video?
If a viewer rewatched parts of the video, that time is also included in the average watch time per play, so the average may be longer than the video.
Why does the same video appear in multiple rows in the report?
Videos inserted into different blocks are counted separately: each block has its own row.
A student just watched the video, but it's not in the report – why?
A view appears in the report when a student closes the tab or leaves the page. If the tab stays open, the data will appear later, within 13 hours. Views currently in progress aren't visible yet.
Which day and time is the view counted for?
On the day the viewing started: if it started at 23:50 and ended after midnight, the entire viewing counts toward the day it started. The period is calculated using your profile's time zone, or UTC if no time zone is set.
Why don't the numbers in the "Students" table match the curve for the selected period?
Student data covers all time, while the curve above shows only the selected period.
Why are there fewer people in the students table than the total number of viewers?
The students table shows only those you have permission to see, while the totals include all viewers.
How can I quickly find where students stop watching a video?
Open the video's "Detailed Analysis" and click a dip in the views graph. The player will jump to that exact moment if the video supports seeking.
Thanks for your feedback!
Thanks! We'll update the article. Need an answer now? Contact support